
Page 128 - Azerbaijan State University of Economics
P. 128
THE PUBLIC INVESTMENTS IN AZERBAIJAN: THEORETICAL AND PRACTICAL ASPECTS
government was equal to 37.1% from gross disposable income generated
during the indicated period in Azerbaijan. Share of gross domestic product
in amount of 52% in 2008, 42.4% in 2009, 45.8% in 2010 was generated by
the oil and gas extraction sectors. Researches indicate that in 2008 the gross
domestic product increased by 45.5%, in 2009 by 47.8%, in 2010 48.1% in
comparison with 2000 basically due to increase of revenues in oil and gas
sector. At the same time the specifics of the oil and gas industry is high
return (income) rates. Thus, in total net mixed income accounted to 88%
and 85.6% of output in 2009 and 2010 respectively (for example, the
refining industry generated only 29.2% and 25% of total net mixed income
in 2009 and 2010 respectively). Majority of this income is transferred to the
government and this fact increases its investment opportunities.
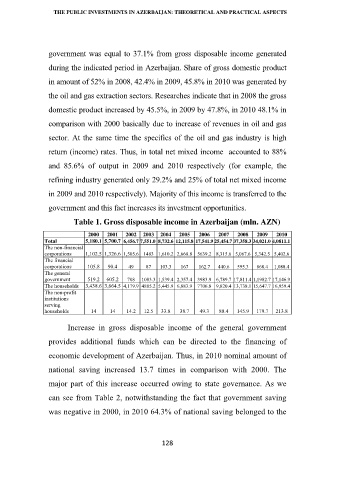
Table 1. Gross disposable income in Azerbaijan (mln. AZN)
2000 2001 2002 2003 2004 2005 2006 2007 2008 2009 2010
Total 5,180.1 5,700.7 6,456.7 7,551.0 8,732.6 12,115.8 17,541.9 25,454.7 37,358.3 34,021.0 4,0811.1
The non-financial
corporations 1,102.5 1,326.6 1,505.6 1483 1,610.2 2,668.8 5639.2 8,315.6 5,067.6 5,342.5 5,402.6
The financial
corporations 105.8 90.4 49 87 103.3 167 162.7 440.6 595.3 868.4 1,088.4
The general
government 519.2 605.2 708 1083.3 1,539.4 2,357.4 3983.9 6,789.7 17,811.4 1,1982.7 17,146.9
The households 3,438.6 3,664.5 4,179.9 4885.2 5,445.9 6,883.9 7706.8 9,820.4 13,738.1 15,647.7 16,959.4
The non-profit
institutions
serving
households 14 14 14.2 12.5 33.8 38.7 49.3 88.4 145.9 179.7 213.8
Increase in gross disposable income of the general government
provides additional funds which can be directed to the financing of
economic development of Azerbaijan. Thus, in 2010 nominal amount of
national saving increased 13.7 times in comparison with 2000. The
major part of this increase occurred owing to state governance. As we
can see from Table 2, notwithstanding the fact that government saving
was negative in 2000, in 2010 64.3% of national saving belonged to the
128