
Page 130 - Azerbaijan State University of Economics
P. 130
THE PUBLIC INVESTMENTS IN AZERBAIJAN: THEORETICAL AND PRACTICAL ASPECTS
in Azerbaijan. In such case the role of the government in the economic
development and its financing increased.
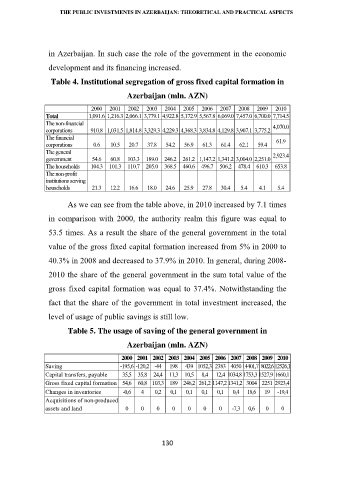
Table 4. Institutional segregation of gross fixed capital formation in
Azerbaijan (mln. AZN)
2000 2001 2002 2003 2004 2005 2006 2007 2008 2009 2010
Total 1,091.6 1,216.3 2,066.1 3,779.1 4,922.8 5,172.9 5,567.8 6,069.0 7,457.0 6,700.0 7,714.5
The non-financial 4,070.0
corporations 910.8 1,031.5 1,814.8 3,329.3 4,229.3 4,368.3 3,834.8 4,129.8 3,907.1 3,775.2
The financial 61.9
corporations 0.6 10.5 20.7 37.8 54.2 56.9 61.3 61.4 62.1 59.4
The general 2,923.4
government 54.6 60.8 103.3 189.0 246.2 261.2 1,147.2 1,341.2 3,004.0 2,251.0
The households 104.3 101.3 110.7 205.0 368.5 460.6 496.7 506.2 478.4 610.3 653.8
The non-profit
institutions serving
households 21.3 12.2 16.6 18.0 24.6 25.9 27.8 30.4 5.4 4.1 5.4
As we can see from the table above, in 2010 increased by 7.1 times
in comparison with 2000, the authority realm this figure was equal to
53.5 times. As a result the share of the general government in the total
value of the gross fixed capital formation increased from 5% in 2000 to
40.3% in 2008 and decreased to 37.9% in 2010. In general, during 2008-
2010 the share of the general government in the sum total value of the
gross fixed capital formation was equal to 37.4%. Notwithstanding the
fact that the share of the government in total investment increased, the
level of usage of public savings is still low.
Table 5. The usage of saving of the general government in
Azerbaijan (mln. AZN)
2000 2001 2002 2003 2004 2005 2006 2007 2008 2009 2010
Saving -195,6 -120,2 -44 198 439 1052,3 2383 405014401,7 8022,6 12526,1
Capital transfers, payable 35,5 35,8 24,4 11,3 10,5 8,4 12,4 1034,81753,3 1527,9 1660,1
Gross fixed capital formation 54,6 60,8 103,3 189 246,2 261,2 1147,21341,2 3004 2251 2923,4
Changes in inventories -0,6 4 0,2 0,1 0,1 0,1 0,1 0,4 18,6 19 -19,4
Acquisitions of non-produced
assets and land 0 0 0 0 0 0 0 -7,3 0,6 0 0
130