
Page 129 - Azerbaijan State University of Economics
P. 129
THE JOURNAL OF ECONOMIC SCIENCES: THEORY AND PRACTICE
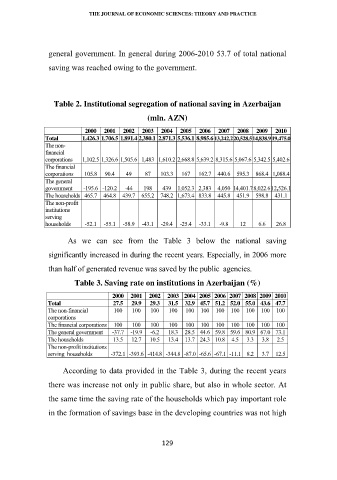
general government. In general during 2006-2010 53.7 of total national
saving was reached owing to the government.
Table 2. Institutional segregation of national saving in Azerbaijan
(mln. AZN)
2000 2001 2002 2003 2004 2005 2006 2007 2008 2009 2010
Total 1,426.3 1,706.5 1,891.4 2,380.1 2,871.3 5,536.1 8,985.613,242.220,528.5 14,838.9 19,475.0
The non-
financial
corporations 1,102.5 1,326.6 1,505.6 1,483 1,610.2 2,668.8 5,639.2 8,315.6 5,067.6 5,342.5 5,402.6
The financial
corporations 105.8 90.4 49 87 103.3 167 162.7 440.6 595.3 868.4 1,088.4
The general
government -195.6 -120.2 -44 198 439 1,052.3 2,383 4,050 14,401.78,022.6 12,526.1
The households 465.7 464.8 439.7 655.2 748.2 1,673.4 833.8 445.8 451.9 598.8 431.1
The non-profit
institutions
serving
households -52.1 -55.1 -58.9 -43.1 -29.4 -25.4 -33.1 -9.8 12 6.6 26.8
As we can see from the Table 3 below the national saving
significantly increased in during the recent years. Especially, in 2006 more
than half of generated revenue was saved by the public agencies.
Table 3. Saving rate on institutions in Azerbaijan (%)
2000 2001 2002 2003 2004 2005 2006 2007 2008 2009 2010
Total 27.5 29.9 29.3 31.5 32.9 45.7 51.2 52.0 55.0 43.6 47.7
The non-financial 100 100 100 100 100 100 100 100 100 100 100
corporations
The financial corporations 100 100 100 100 100 100 100 100 100 100 100
The general government -37.7 -19.9 -6.2 18.3 28.5 44.6 59.8 59.6 80.9 67.0 73.1
The households 13.5 12.7 10.5 13.4 13.7 24.3 10.8 4.5 3.3 3.8 2.5
The non-profit institutions
serving households -372.1 -393.6 -414.8 -344.8 -87.0 -65.6 -67.1 -11.1 8.2 3.7 12.5
According to data provided in the Table 3, during the recent years
there was increase not only in public share, but also in whole sector. At
the same time the saving rate of the households which pay important role
in the formation of savings base in the developing countries was not high
129