
Page 10 - Azerbaijan State University of Economics
P. 10
THE JOURNAL OF ECONOMIC SCIENCES: THEORY AND PRACTICE, V.75, # 2, 2018, pp. 4-16
Over the entire life of Nasdaq, all 18 instances of extremely low volatility (MAPC smaller
than 0.3%), occurred during the first twenty years from 1971 to 1990. So, it is obvious
that Nasdaq has become much more volatile since 1991. In other words, those investing
in Nasdaq and the Nasdaq stocks post-1990 must learn to live with high volatility.
Looking at individual values of the monthly percentage changes, the most volatility
was experienced during April 2000 with MAPC equal to 4.3%, followed by October
2008 with 3.76%, November 2008 with 3.54%, April 2001 with 3.44%, December
2000 with 3.37% and October 1987 with 3.19% (month with the “Black Monday”).
IV. ANALYSIS OF RESULTS
Month effect: Comparison of MAPC for Each Month
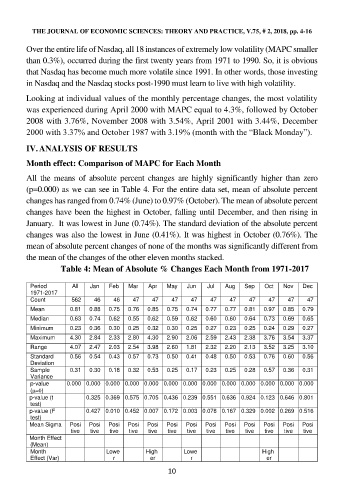
All the means of absolute percent changes are highly significantly higher than zero
(p=0.000) as we can see in Table 4. For the entire data set, mean of absolute percent
changes has ranged from 0.74% (June) to 0.97% (October). The mean of absolute percent
changes have been the highest in October, falling until December, and then rising in
January. It was lowest in June (0.74%). The standard deviation of the absolute percent
changes was also the lowest in June (0.41%). It was highest in October (0.76%). The
mean of absolute percent changes of none of the months was significantly different from
the mean of the changes of the other eleven months stacked.
Table 4: Mean of Absolute % Changes Each Month from 1971-2017
Period All Jan Feb Mar Apr May Jun Jul Aug Sep Oct Nov Dec
1971-2017
Count 562 46 46 47 47 47 47 47 47 47 47 47 47
Mean 0.81 0.88 0.75 0.76 0.85 0.75 0.74 0.77 0.77 0.81 0.97 0.85 0.79
Median 0.63 0.74 0.62 0.55 0.62 0.59 0.62 0.60 0.60 0.64 0.73 0.69 0.65
Minimum 0.23 0.36 0.30 0.25 0.32 0.30 0.25 0.27 0.23 0.25 0.24 0.29 0.27
Maximum 4.30 2.84 2.33 2.80 4.30 2.90 2.06 2.59 2.43 2.38 3.76 3.54 3.37
Range 4.07 2.47 2.03 2.54 3.98 2.60 1.81 2.32 2.20 2.13 3.52 3.25 3.10
Standard 0.56 0.54 0.43 0.57 0.73 0.50 0.41 0.48 0.50 0.53 0.76 0.60 0.56
Deviation
Sample 0.31 0.30 0.18 0.32 0.53 0.25 0.17 0.23 0.25 0.28 0.57 0.36 0.31
Variance
p-value 0.000 0.000 0.000 0.000 0.000 0.000 0.000 0.000 0.000 0.000 0.000 0.000 0.000
()
p-value (t 0.325 0.369 0.575 0.705 0.436 0.239 0.551 0.636 0.924 0.123 0.646 0.801
test)
p-value (F 0.427 0.010 0.452 0.007 0.172 0.003 0.078 0.167 0.329 0.002 0.269 0.516
test)
Mean Sigma Posi Posi Posi Posi Posi Posi Posi Posi Posi Posi Posi Posi Posi
tive tive tive tive tive tive tive tive tive tive tive tive tive
Month Effect
(Mean)
Month Lowe High Lowe High
Effect (Var) r er r er
10