
Page 9 - Azerbaijan State University of Economics
P. 9
Shaikh A. Hamid, Tej S. Dhakar: Anamolous Behavior of the Volatility of Nasdaq
Composite Index: 1971 To 2017
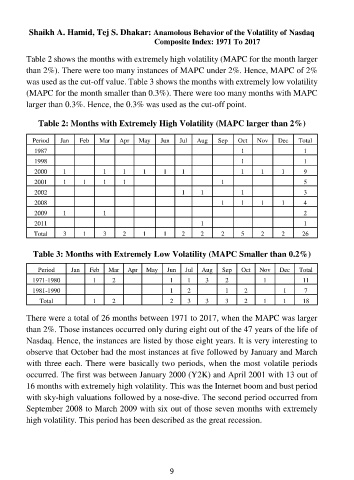
Table 2 shows the months with extremely high volatility (MAPC for the month larger
than 2%). There were too many instances of MAPC under 2%. Hence, MAPC of 2%
was used as the cut-off value. Table 3 shows the months with extremely low volatility
(MAPC for the month smaller than 0.3%). There were too many months with MAPC
larger than 0.3%. Hence, the 0.3% was used as the cut-off point.
Table 2: Months with Extremely High Volatility (MAPC larger than 2%)
Period Jan Feb Mar Apr May Jun Jul Aug Sep Oct Nov Dec Total
1987 1 1
1998 1 1
2000 1 1 1 1 1 1 1 1 1 9
2001 1 1 1 1 1 5
2002 1 1 1 3
2008 1 1 1 1 4
2009 1 1 2
2011 1 1
Total 3 1 3 2 1 1 2 2 2 5 2 2 26
Table 3: Months with Extremely Low Volatility (MAPC Smaller than 0.2%)
Period Jan Feb Mar Apr May Jun Jul Aug Sep Oct Nov Dec Total
1971-1980 1 2 1 1 3 2 1 11
1981-1990 1 2 1 2 1 7
Total 1 2 2 3 3 3 2 1 1 18
There were a total of 26 months between 1971 to 2017, when the MAPC was larger
than 2%. Those instances occurred only during eight out of the 47 years of the life of
Nasdaq. Hence, the instances are listed by those eight years. It is very interesting to
observe that October had the most instances at five followed by January and March
with three each. There were basically two periods, when the most volatile periods
occurred. The first was between January 2000 (Y2K) and April 2001 with 13 out of
16 months with extremely high volatility. This was the Internet boom and bust period
with sky-high valuations followed by a nose-dive. The second period occurred from
September 2008 to March 2009 with six out of those seven months with extremely
high volatility. This period has been described as the great recession.
9