
Page 12 - Azerbaijan State University of Economics
P. 12
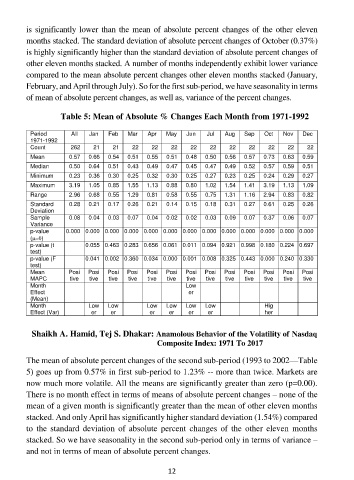
is significantly lower than the mean of absolute percent changes of the other eleven
months stacked. The standard deviation of absolute percent changes of October (0.37%)
is highly significantly higher than the standard deviation of absolute percent changes of
other eleven months stacked. A number of months independently exhibit lower variance
compared to the mean absolute percent changes other eleven months stacked (January,
February, and April through July). So for the first sub-period, we have seasonality in terms
of mean of absolute percent changes, as well as, variance of the percent changes.
Table 5: Mean of Absolute % Changes Each Month from 1971-1992
Period All Jan Feb Mar Apr May Jun Jul Aug Sep Oct Nov Dec
1971-1992
Count 262 21 21 22 22 22 22 22 22 22 22 22 22
Mean 0.57 0.66 0.54 0.51 0.55 0.51 0.48 0.50 0.56 0.57 0.73 0.63 0.59
Median 0.50 0.64 0.51 0.43 0.49 0.47 0.45 0.47 0.49 0.52 0.57 0.59 0.51
Minimum 0.23 0.36 0.30 0.25 0.32 0.30 0.25 0.27 0.23 0.25 0.24 0.29 0.27
Maximum 3.19 1.05 0.85 1.55 1.13 0.88 0.80 1.02 1.54 1.41 3.19 1.13 1.09
Range 2.96 0.68 0.55 1.29 0.81 0.58 0.55 0.75 1.31 1.16 2.94 0.83 0.82
Standard 0.28 0.21 0.17 0.26 0.21 0.14 0.15 0.18 0.31 0.27 0.61 0.25 0.26
Deviation
Sample 0.08 0.04 0.03 0.07 0.04 0.02 0.02 0.03 0.09 0.07 0.37 0.06 0.07
Variance
p-value 0.000 0.000 0.000 0.000 0.000 0.000 0.000 0.000 0.000 0.000 0.000 0.000 0.000
()
p-value (t 0.055 0.463 0.283 0.656 0.061 0.011 0.094 0.921 0.998 0.180 0.224 0.697
test)
p-value (F 0.041 0.002 0.360 0.034 0.000 0.001 0.008 0.325 0.443 0.000 0.240 0.330
test)
Mean Posi Posi Posi Posi Posi Posi Posi Posi Posi Posi Posi Posi Posi
MAPC tive tive tive tive tive tive tive tive tive tive tive tive tive
Month Low
Effect er
(Mean)
Month Low Low Low Low Low Low Hig
Effect (Var) er er er er er er her
Shaikh A. Hamid, Tej S. Dhakar: Anamolous Behavior of the Volatility of Nasdaq
Composite Index: 1971 To 2017
The mean of absolute percent changes of the second sub-period (1993 to 2002—Table
5) goes up from 0.57% in first sub-period to 1.23% -- more than twice. Markets are
now much more volatile. All the means are significantly greater than zero (p=0.00).
There is no month effect in terms of means of absolute percent changes – none of the
mean of a given month is significantly greater than the mean of other eleven months
stacked. And only April has significantly higher standard deviation (1.54%) compared
to the standard deviation of absolute percent changes of the other eleven months
stacked. So we have seasonality in the second sub-period only in terms of variance –
and not in terms of mean of absolute percent changes.
12