
Page 11 - Azerbaijan State University of Economics
P. 11
Gorkhmaz Imanov, Asif Aliyev : Fuzzy Linguistic Forecasting of Social Mobility
21 240.1-280.0 0.021 300- more 0.052 450,1-500,0 0.019
22 280 – more 0.03 - - 500,1-550,0 0.011
23 - - - - 550-more 0.018
www.azstat.gov.az
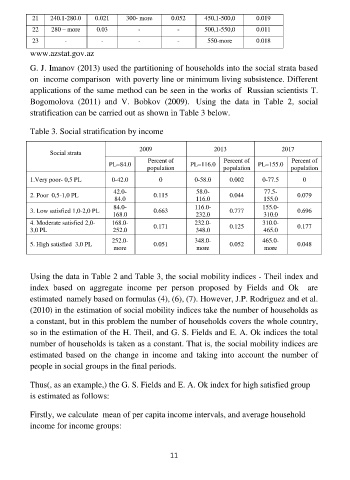
G. J. Imanov (2013) used the partitioning of households into the social strata based
on income comparison with poverty line or minimum living subsistence. Different
applications of the same method can be seen in the works of Russian scientists T.
Bogomolova (2011) and V. Bobkov (2009). Using the data in Table 2, social
stratification can be carried out as shown in Table 3 below.
Table 3. Social stratification by income
2009 2013 2017
Social strata
Percent of Percent of Percent of
PL=84.0 PL=116.0 PL=155.0
population population population
1.Very poor- 0,5 PL 0-42.0 0 0-58.0 0.002 0-77.5 0
42.0- 58.0- 77.5-
2. Poor 0,5-1,0 PL 0.115 0.044 0.079
84.0 116.0 155.0
84.0- 116.0- 155.0-
3. Low satisfied 1,0-2,0 PL 0.663 0.777 0.696
168.0 232.0 310.0
4. Moderate satisfied 2,0- 168.0- 0.171 232.0- 0.125 310.0- 0.177
3,0 PL 252.0 348.0 465.0
252.0- 348.0- 465.0-
5. High satisfied 3,0 PL 0.051 0.052 0.048
more more more
Using the data in Table 2 and Table 3, the social mobility indices - Theil index and
index based on aggregate income per person proposed by Fields and Ok are
estimated namely based on formulas (4), (6), (7). However, J.P. Rodriguez and et al.
(2010) in the estimation of social mobility indices take the number of households as
a constant, but in this problem the number of households covers the whole country,
so in the estimation of the H. Theil, and G. S. Fields and E. A. Ok indices the total
number of households is taken as a constant. That is, the social mobility indices are
estimated based on the change in income and taking into account the number of
people in social groups in the final periods.
Thus(, as an example,) the G. S. Fields and E. A. Ok index for high satisfied group
is estimated as follows:
Firstly, we calculate mean of per capita income intervals, and average household
income for income groups:
11