
Page 70 - Azerbaijan State University of Economics
P. 70
THE JOURNAL OF ECONOMIC SCIENCES: THEORY AND PRACTICE, V.83, # 1, 2026, pp. 58-81
To reduce potential bias due to non-normality, the skewed variables were transformed
logarithmically prior to inclusion in the econometric models. A common solution in
econometrics to right-skewed variables is to take log transformations, which make the
models easier to interpret and also help limit the degree of heteroscedasticity
(Wooldridge, 2010).
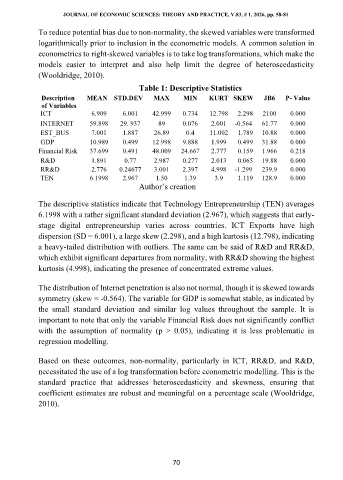
Table 1: Descriptive Statistics
Description MEAN STD.DEV MAX MIN KURT SKEW JB6 P- Value
of Variables
ICT 6.909 6.001 42.999 0.734 12.798 2.298 2100 0.000
INTERNET 59.898 29. 937 89 0.076 2.001 -0.564 61.77 0.000
EST_BUS 7.001 1.887 26.89 0.4 11.002 1.789 10.88 0.000
GDP 10.989 0.499 12.998 9.888 1.999 0.499 31.88 0.000
Financial Risk 37.699 0.491 48.009 24.667 2.777 0.159 1.966 0.218
R&D 1.891 0.77 2.987 0.277 2.013 0.065 19.88 0.000
RR&D 2.776 0.24677 3.001 2.397 4.998 -1.299 239.9 0.000
TEN 6.1998 2.967 1.50 1.39 3.9 1.119 128.9 0.000
Author’s creation
The descriptive statistics indicate that Technology Entrepreneurship (TEN) averages
6.1998 with a rather significant standard deviation (2.967), which suggests that early-
stage digital entrepreneurship varies across countries. ICT Exports have high
dispersion (SD = 6.001), a large skew (2.298), and a high kurtosis (12.798), indicating
a heavy-tailed distribution with outliers. The same can be said of R&D and RR&D,
which exhibit significant departures from normality, with RR&D showing the highest
kurtosis (4.998), indicating the presence of concentrated extreme values.
The distribution of Internet penetration is also not normal, though it is skewed towards
symmetry (skew = -0.564). The variable for GDP is somewhat stable, as indicated by
the small standard deviation and similar log values throughout the sample. It is
important to note that only the variable Financial Risk does not significantly conflict
with the assumption of normality (p > 0.05), indicating it is less problematic in
regression modelling.
Based on these outcomes, non-normality, particularly in ICT, RR&D, and R&D,
necessitated the use of a log transformation before econometric modelling. This is the
standard practice that addresses heteroscedasticity and skewness, ensuring that
coefficient estimates are robust and meaningful on a percentage scale (Wooldridge,
2010).
70