
Page 48 - Azerbaijan State University of Economics
P. 48
THE JOURNAL OF ECONOMIC SCIENCES: THEORY AND PRACTICE, V.82, # 2, 2025, pp. 32-60
For the INFLATION variable, the variance decomposition shows strong self-explanation
from the outset (94% in period 1), but this share slowly declines to around 86.7% in period
10, indicating structural stability of inflation. However, the growing impact of public
spending (4.5% in period 10) on inflation is indicative of a demand effect, probably due to
the injection of liquidity via fiscal policies. The marginal but nonnegligible role of
unemployment (1.8% in period 10) suggests low price-employment sensitivity in the
Algerian context, which could be explained by the duality of the labor market and price
regulation through subsidies or administrative control.
Finally, decomposing the variance of the unemployment rate reveals a dynamic strongly
influenced by the other variables. While more than 84% of unemployment is initially
explained by its own shocks, this share falls to 41% in period 10. Real GDP becomes the
major source of variation in unemployment (nearly 40% in period 10), confirming a robust
inverse relationship between economic activity and employment, in line with Okun's law.
Public spending, meanwhile, explains around 12.4% of the variance in unemployment over
the long horizon, confirming its employment-supporting effect, albeit limited over time.
These results highlight the structural dependence of the Algerian labor market on economic
growth and fiscal policies, in a context where structural reforms remain insufficiently
entrenched.
Validation of the estimated SVAR(1) model
This subsection presents the validation of the SVAR(1) model to ensure its statistical
soundness and reliability. We assess the model through key diagnostic tests, including
residual autocorrelation, stability, and normality checks. These validations are
essential before interpreting structural shocks and impulse response functions.
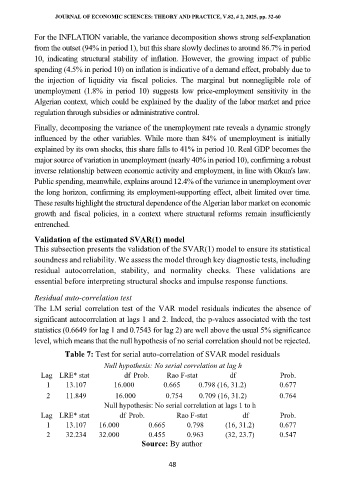
Residual auto-correlation test
The LM serial correlation test of the VAR model residuals indicates the absence of
significant autocorrelation at lags 1 and 2. Indeed, the p-values associated with the test
statistics (0.6649 for lag 1 and 0.7543 for lag 2) are well above the usual 5% significance
level, which means that the null hypothesis of no serial correlation should not be rejected.
Table 7: Test for serial auto-correlation of SVAR model residuals
Null hypothesis: No serial correlation at lag h
Lag LRE* stat df Prob. Rao F-stat df Prob.
1 13.107 16.000 0.665 0.798 (16, 31.2) 0.677
2 11.849 16.000 0.754 0.709 (16, 31.2) 0.764
Null hypothesis: No serial correlation at lags 1 to h
Lag LRE* stat df Prob. Rao F-stat df Prob.
1 13.107 16.000 0.665 0.798 (16, 31.2) 0.677
2 32.234 32.000 0.455 0.963 (32, 23.7) 0.547
Source: By author
48