
Page 30 - Azerbaijan State University of Economics
P. 30
THE JOURNAL OF ECONOMIC SCIENCES: THEORY AND PRACTICE, V.83, # 1, 2026, pp. 20-39
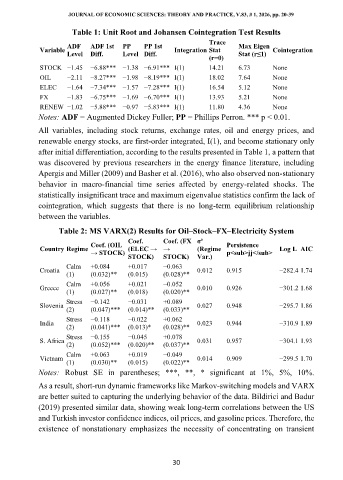
Table 1: Unit Root and Johansen Cointegration Test Results
Trace
ADF ADF 1st PP PP 1st Max Eigen
Variable Integration Stat Cointegration
Level Diff. Level Diff. Stat (r≤1)
(r=0)
STOCK −1.45 −6.88*** −1.38 −6.91*** I(1) 14.21 6.73 None
OIL −2.11 −8.27*** −1.98 −8.19*** I(1) 18.02 7.64 None
ELEC −1.64 −7.34*** −1.57 −7.28*** I(1) 16.54 5.12 None
FX −1.83 −6.75*** −1.69 −6.70*** I(1) 13.93 5.21 None
RENEW −1.02 −5.88*** −0.97 −5.83*** I(1) 11.80 4.36 None
Notes: ADF = Augmented Dickey Fuller; PP = Phillips Perron. *** p < 0.01.
All variables, including stock returns, exchange rates, oil and energy prices, and
renewable energy stocks, are first-order integrated, I(1), and become stationary only
after initial differentiation, according to the results presented in Table 1, a pattern that
was discovered by previous researchers in the energy finance literature, including
Apergis and Miller (2009) and Basher et al. (2016), who also observed non-stationary
behavior in macro-financial time series affected by energy-related shocks. The
statistically insignificant trace and maximum eigenvalue statistics confirm the lack of
cointegration, which suggests that there is no long-term equilibrium relationship
between the variables.
Table 2: MS VARX(2) Results for Oil–Stock–FX–Electricity System
Coef. Coef. (FX σ²
Coef. (OIL Persistence
Country Regime (ELEC → → (Regime Log L AIC
→ STOCK) p<sub>jj</sub>
STOCK) STOCK) Var.)
Calm +0.084 +0.017 −0.063
Croatia 0.012 0.915 −282.4 1.74
(1) (0.032)** (0.015) (0.028)**
Calm +0.056 +0.021 −0.052
Greece 0.010 0.926 −301.2 1.68
(1) (0.027)** (0.018) (0.020)**
Stress −0.142 −0.031 +0.089
Slovenia 0.027 0.948 −295.7 1.86
(2) (0.047)*** (0.014)** (0.033)**
Stress −0.118 −0.022 +0.062
India 0.023 0.944 −310.9 1.89
(2) (0.041)*** (0.013)* (0.028)**
Stress −0.155 −0.045 +0.078
S. Africa 0.031 0.957 −304.1 1.93
(2) (0.052)*** (0.020)** (0.037)**
Calm +0.063 +0.019 −0.049
Vietnam 0.014 0.909 −299.5 1.70
(1) (0.030)** (0.015) (0.022)**
Notes: Robust SE in parentheses; ***, **, * significant at 1%, 5%, 10%.
As a result, short-run dynamic frameworks like Markov-switching models and VARX
are better suited to capturing the underlying behavior of the data. Bildirici and Badur
(2019) presented similar data, showing weak long-term correlations between the US
and Turkish investor confidence indices, oil prices, and gasoline prices. Therefore, the
existence of nonstationary emphasizes the necessity of concentrating on transient
30